KPI Dashboard
Executive KPI dashboard with Products/Customers/HR trends.
Tools
Overview
Business-style KPI dashboard built on Microsoft's AdventureWorks database.
The dashboard includes: Executive (overview), Products (merchandising & inventory), Customers (growth & retention), and HR (org efficiency). This project focuses primarily on providing critical data for executives and employees within the company conveniently.
Database
Source: AdventureWorksDW. Timeframe standardized to the latest complete month (capped at 2012-13 in this build).
Filters: Month selector (current vs prior), Category/Region filters on detail pages; Executive remains deliberately minimal for at-a-glance review.
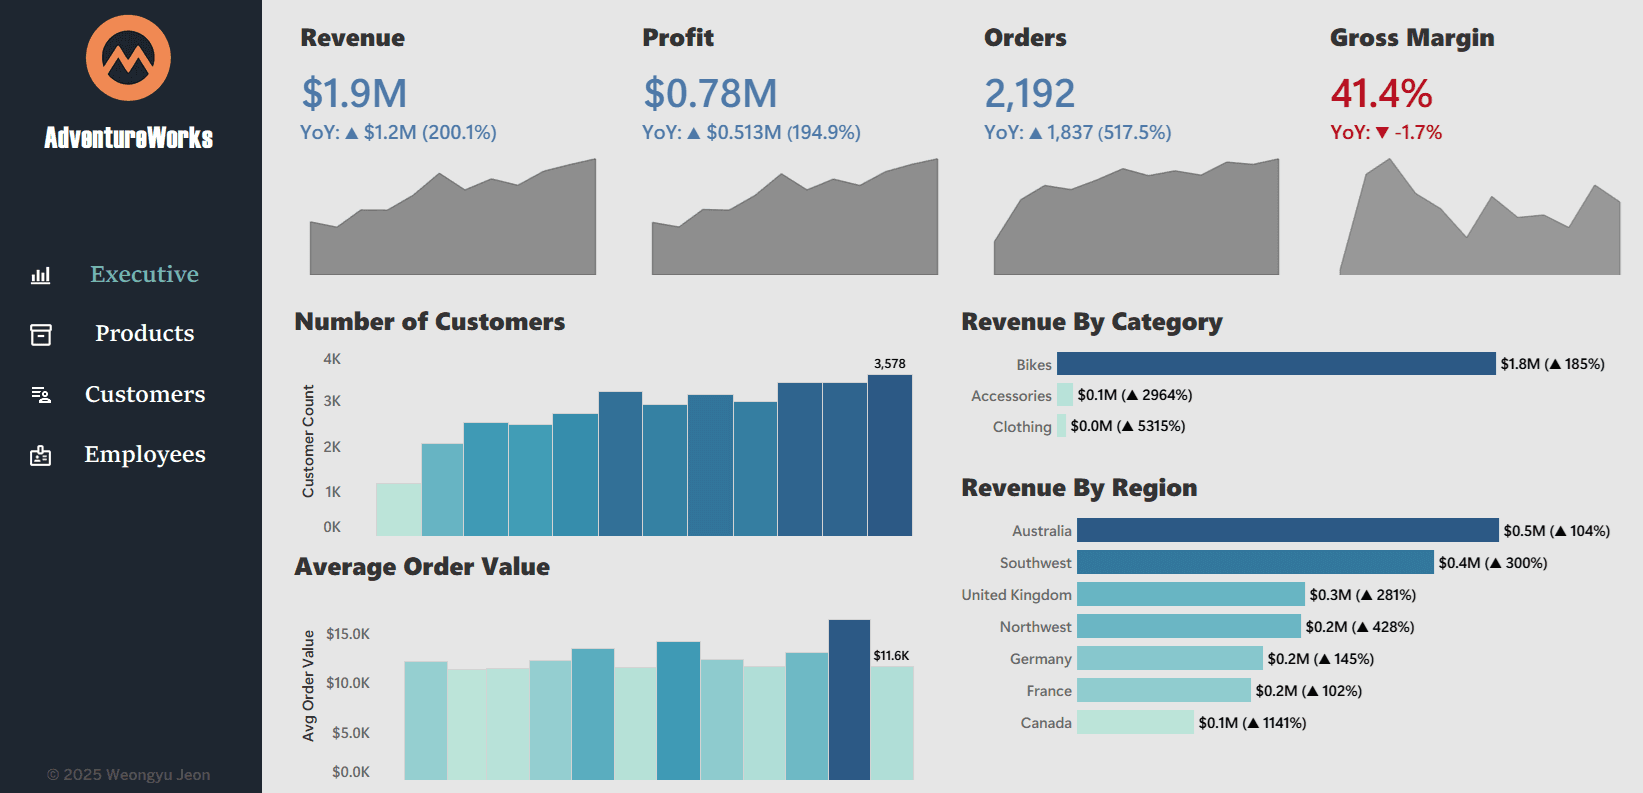
Executive Page
Top row KPI cards: Revenue, Profit, Orders, Gross Margin %, Customer Count, and AOV.
KPI micro-trends: Sparkline (last 12 months) embedded per card to show context without overwhelming the layout.
Breakdowns: 'Top Categories' (horizontal bars: Revenue, YoY %) and 'Top Regions' (horizontal bars: Revenue, YoY %) for quick mixed insights.
Usability: Most important KPIs for the firm management are conveniently clustered.
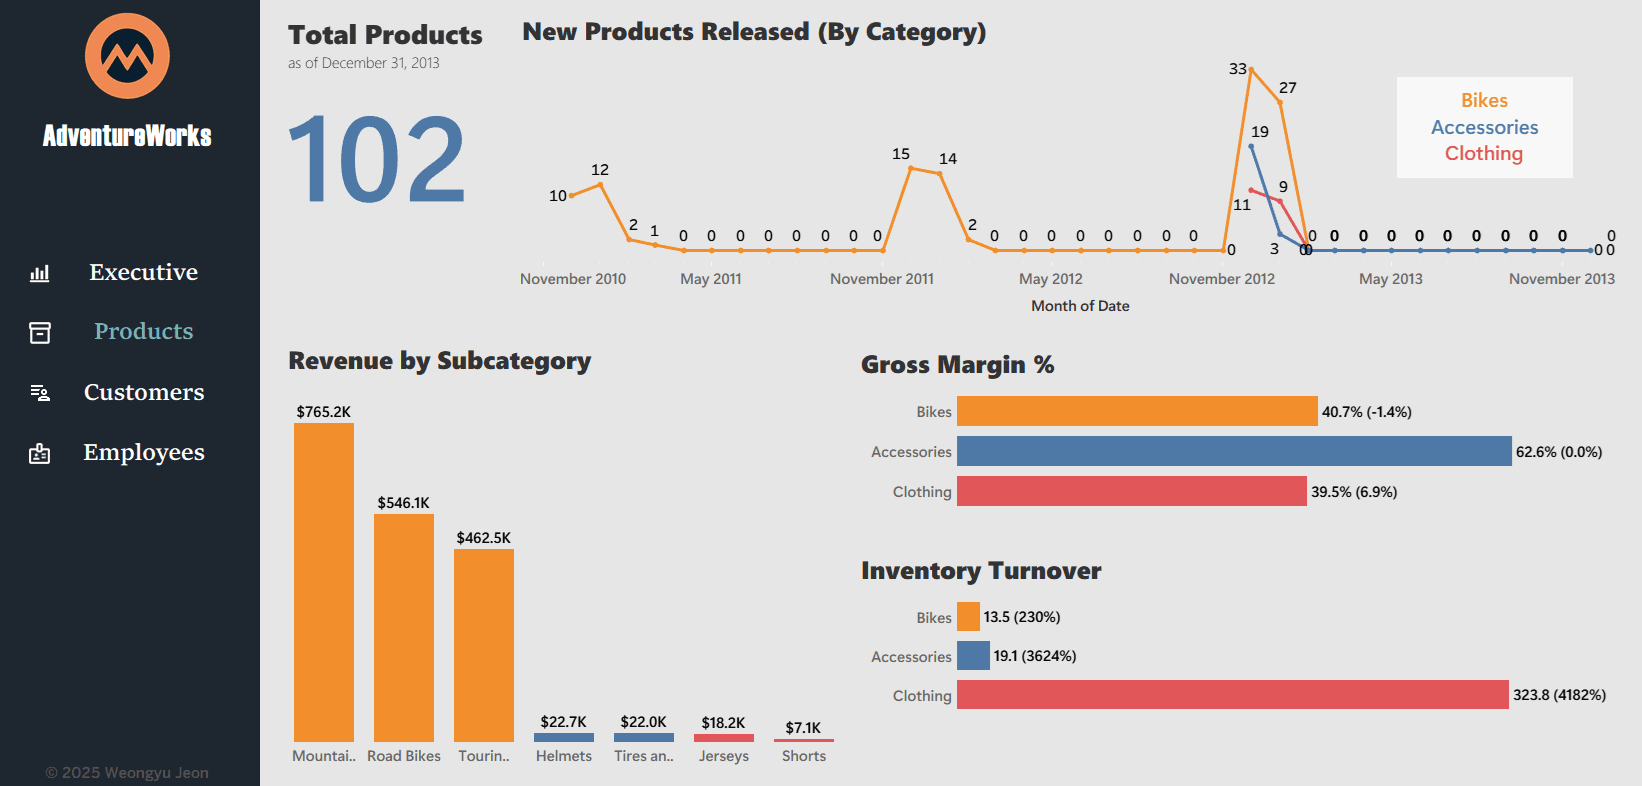
Products Page
KPIs: Total # of Active Products, New Products This Month, and basic inventory health snapshot.
Category Performance: 3 measures side-by-side per category (Revenue, GM %, Inventory Turnover).
Subcategory Breakdown: Horizontal bar with YoY %; optional sparkline trend per subcategory for volatility.
Usability: Understanding of margin/inventory pressure per product categories.
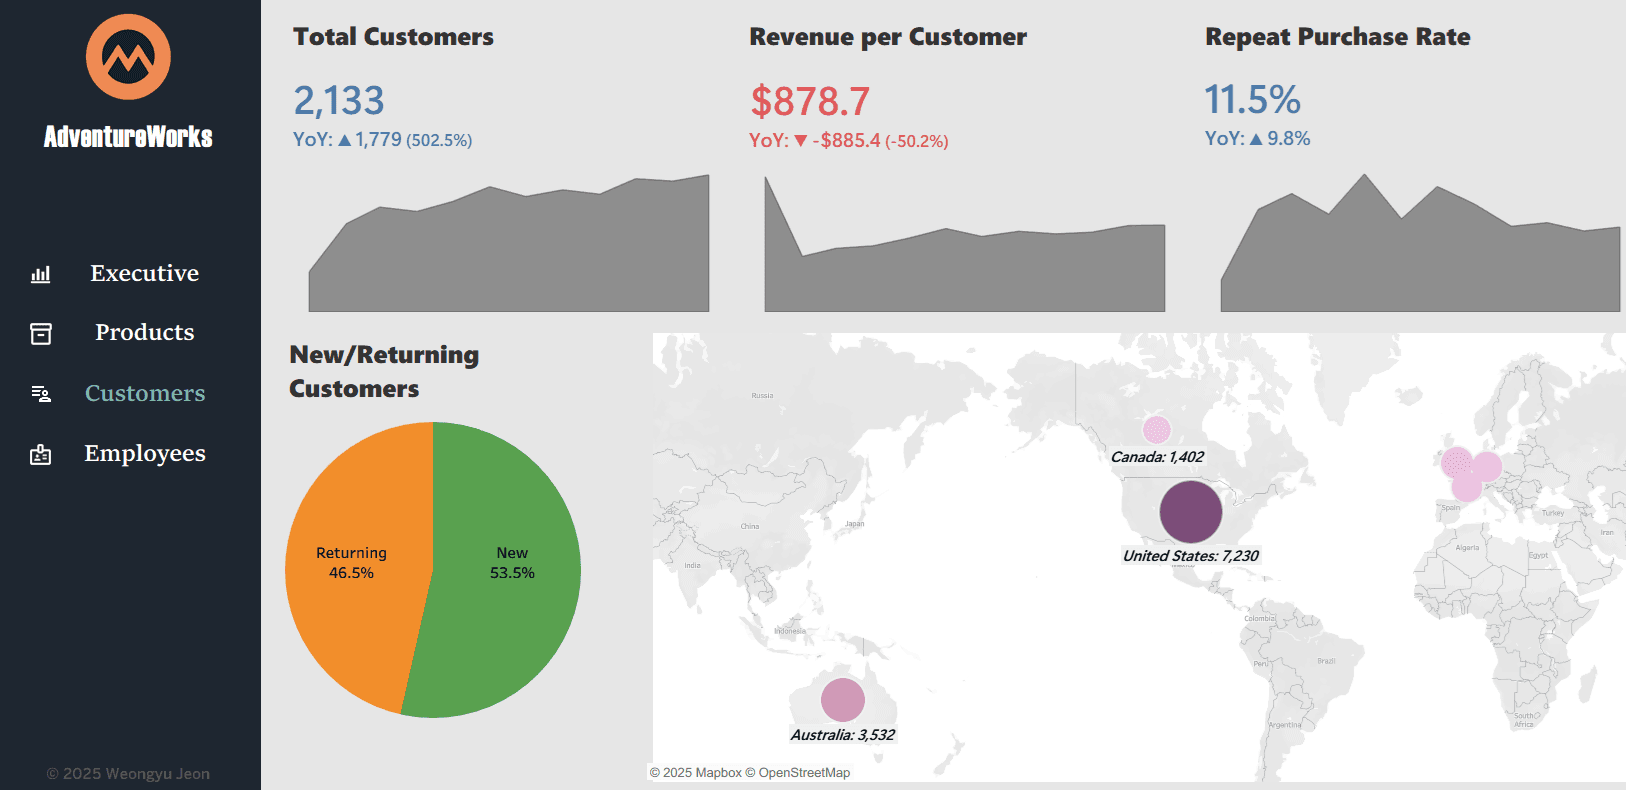
Customers Page
KPIs: Total Customers (with YoY), Avg Revenue per Customer, and Repeat Purchase Rate.
New vs Returning: Pi chart to snapshot customer divisions.
Regional Segmentation: Regional breakdowns for quick glance.
Usability: Retaining/developing pool of customers to improve sales performance.
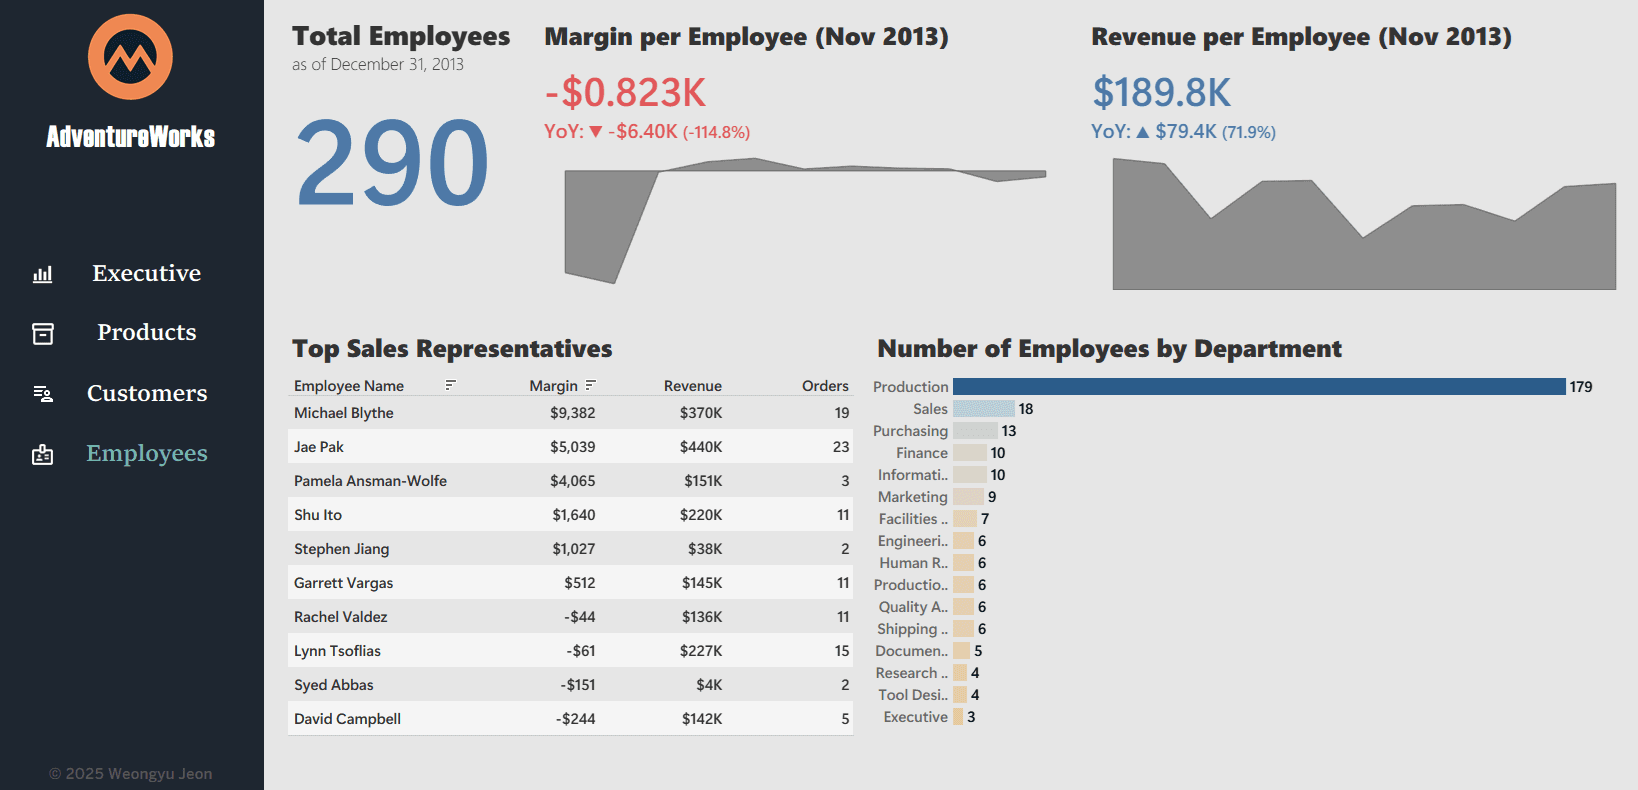
HR Page
KPIs: Total Employees, Revenue per Employee, and Avg Order Value per Employee.
Employees by Department: Bar chart; optional YoY headcount tags.
Leaderboard: Highlight top contributors based on performance metrics.
Usability: Evaluating employee performances for potential improvement in financials.
Implementation Notes
Pipeline: Minimal SQL extracts (month-end grain), with most business math computed in Tableau (table calcs and LODs) to keep the extracts slim.
Dashboard design, KPIs, and calculation formulas could be reused in different cases.